Information and Surroundings of the National Parks
In this part, we analyze the features in the counties where the top 10 national parks locate. We aim to give more local information to travelers who are planning to visit these parks.
Local Crime cases
Safety is always of the highest priority when making travel decisions. We collect crime data from 2016 to 2020 and calculate the crime cases per 1,000 population in local counties. The average crime cases per 1,000 population is about 12, and the Katmai National Park has the largest crime numbers nearby.
Local Amenities
When visiting a new place, travelers often have problem finding parking spaces and restaurant. We gather parking and restaurant data from Open Street Map database and want to give a general sense of these amenities for our users.
Here we present a table describing the corresponding relationship between parks and counties. Users can refer to this table and interact with the map below.
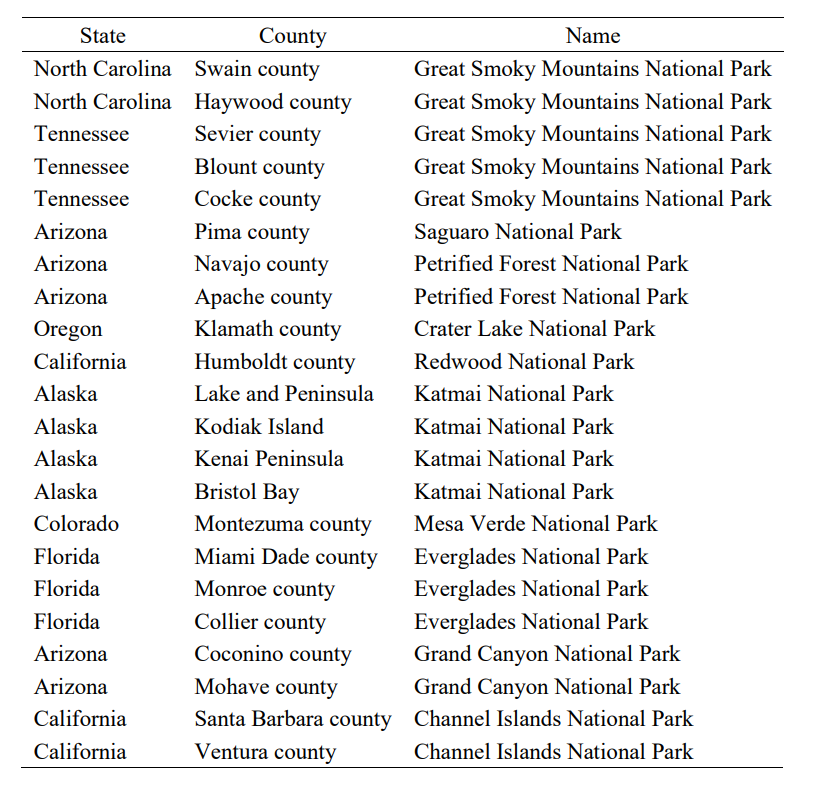
Interact with the selectors and see the distribution of amenities.
Median Household Income
There is a relationship between the income of local households and the regional level of services. We plot the median household income with a spatial unit of census block groups near the national parks. Users can select their park of interest with the selector and enjoy the help of the interactive map.
Weather Data
It’s also important to take a look at the local weather data, especially the temperature and precipitation. Here is the corresponding relationship of national parks and weather stations.
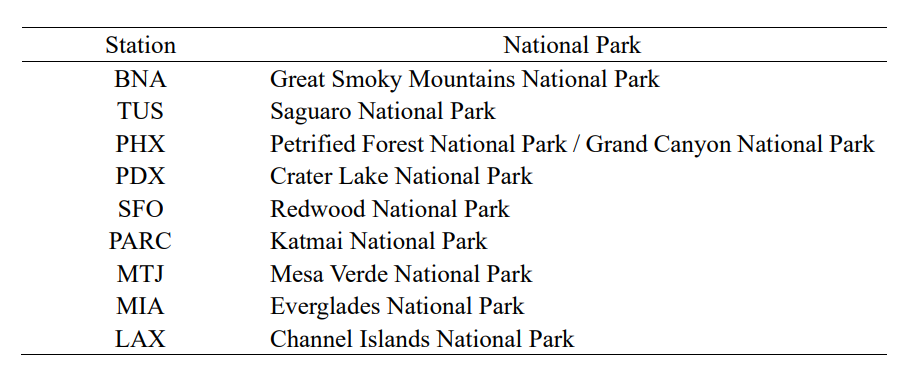
Use the selectors and see the weather data of each stations!